Tools to make you THINK differently about your business
Have you ever thought about who, when and why the traditional “picture” of an organisation, the family tree, was first invented?
The first recorded use of an organisation chart was after a train crash in Massachusetts in 1841. An investigation was headed by a Major Whistler in order to establish the causes of the accident. Major Whistler designed the first organisation chart to describe functional responsibility with …the sole purpose of apportioning blame should another incident occur.
To this day, the focus of the organisation chart remains control; that is, to ensure people do their jobs and do them properly. Over a century and a half later and we are still employing the same thinking!
Additionally, as noted by Prof. John Seddon, “if we design work into functions and give each function its own target, should we be surprised if the functions don’t co-operate with one another”.
That’s not to say that the organisation chart is without merit but research has suggested there is a better diagram which supports a more enlightened approach delivering a more sustained performance.
Traditionally businesses are compared to well-oiled machines but we believe a better analogy would be an organism that will survive or thrive according to how well it performs its sole function: to find, keep and profitably serve its customers.
The question that needs to be asked throughout the whole life of any business is “how do I “systematically” give my customers the best results? The results of the business need to become “system” dependent not “people” dependent.
How to use
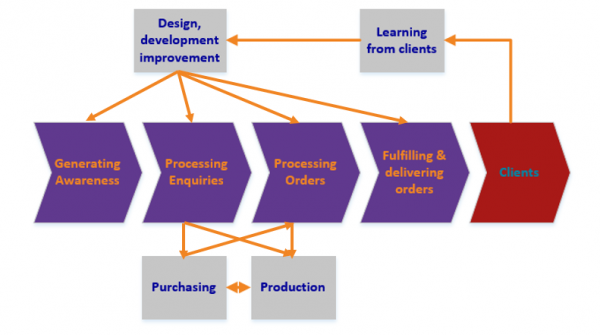
Once the “purpose” of the organisation has been defined (a subject for another day) you need to codify the organisational methods employed to systematically deliver value to the client base. This starts with the production of a flow chart, or what we call a Core Activity Map™, that shows how the various parts of your organisation work together in order to deliver value to your customers. This diagram cuts a line through the organisational chart to show how the work works. At a very basic level we start with the idea that most organisations have very few top-level processes, an example would be:

Work can then begin on examining the parts of the system so that cost and waste are reduced and effectiveness and efficiency is increased. Where required, codifying these processes as part of the relevant ISO management system or book of best practice.
The resulting book of best practice says “this is how we do things here”, without which everybody will do things differently.
As an example, we are now going to see how this thinking was applied to a real company …they:
- are a manufacturer and distributor of electronic products which control the environment (temperature, humidity etc) of offices and workplaces
- have a turnover of £6m which they are looking to grow to £10m over the next 3 years
- export 60% of the products abroad
- have around 40 staff, the majority in the UK
- are one of a small number of business owned by the Chairman who leaves strategic and operational decisions to the appointed managing director
A workshop was held with key staff starting with the above ideas and the following Core Activity Map™ was developed:
As a result of this new view of the company a number of significant organisational changes resulted:
1) The UK manufacturing facility had always previously been regarded as a “core” process, however, as the company were in effect a sales organisation and whilst all of the intellectual property (IP) belonged to the company many of their products were actually made abroad. As a result, the manufacturing function was now treated as any other external supplier.
The benefits included the internal simplification of the processes and the associated simplification of KPI’s.
2) Key staff took responsibility for re-drafting the company’s quality management systems around the above Core Activity Map™
The benefit from which was for the first time the staff responsible for the activities actually took part in the documentation of them. This time they were their systems; there was real ownership.
3) Most importantly, prior to this process the design had always emphasised technical excellence. As a direct result of the new focus on making products for contractors so that they are “quicker and easier” to install, additional design expertise was developed to meet this objective. The focus on technical emphasis remains but in addition to which there is now a real focus on making it easier and quicker to install the products for the contractor base as this factor was considered to be the critical “order winner”.
Conclusion
The benefits of adopting this Core Activity Map™ approach included staff being considerably more focused on what exactly it was that “won orders” from contractors. This in turn resulted in the ability to increase price for the improved convenience and a surge in both orders and customer satisfaction levels.
The benefits of an associated and robust book of best practice included:
- Staff are provided with a written account of how to get stuff done in the most effective and efficient way.
- The talents of your people can be unleashed to find better ways of delivering products and services to your customers and clients
- As new and better ways of doing things are developed it becomes the conduit of communicating these new methods
- It brings new people up to speed quickly so they can be more productive sooner.
Finally, linking the Core Activity Map™ processes to key performance indicators allows a company to drive real and quantifiable change.
Related tools and ideas
- Purpose
- Managing variation
Recommended references
- Dragon Slaying: a better way to manage by Mark Woods; email mwoods@statius.co.uk to receive your free copy
Downloadable resources
- Developing management systems that improve sales and bolster margins
Comments are closed