Tools to make you THINK differently about your business
If you have a serious problem, it’s critical to explore everything that might cause it, before you start thinking about solutions. Ishikawa, or cause-effect analysis, is a brilliant tool for doing just this.
I originally learnt about Ishikawa diagrams (also sometimes called fishbone diagrams or herringbone diagrams) whilst studying for my engineering degree. The idea was developed by in Japan by a guy called Kaoru Ishikawa who was working at the time in the Kawasaki shipyards. He developed the diagrams in order to show the causes of specific events. I initially learnt the 5M model head of the fish described the problem and the bones of the fish bone were indicative of one of the following issues:
- Machine (equipment, technology)
- Method (process)
- Material (includes raw material, consumables, and information)
- Man / mind power (physical or knowledge work)
- Measurement / medium (inspection, environment)
However, as ever, over the years the model has been developed, originally, to include an additional three M’s creating the 8 M model and then into other areas. The additional 3 M’s being:
- 1. Mission / mother nature (purpose, environment)
- 2. Management / money power (leadership)
- 3. Maintenance
However, as I’ve said before on these blogs, these tools should never be about slavish adherence to the tool …they should be about using (and abusing…if necessary) the tool to drive thinking… so we, and others, have used the model with for instance the 8 Ps of the marketing mix.
Product (or service)
- Price
- Promotion
- Place
- Process
- People (personnel)
- Physical evidence
- Performance
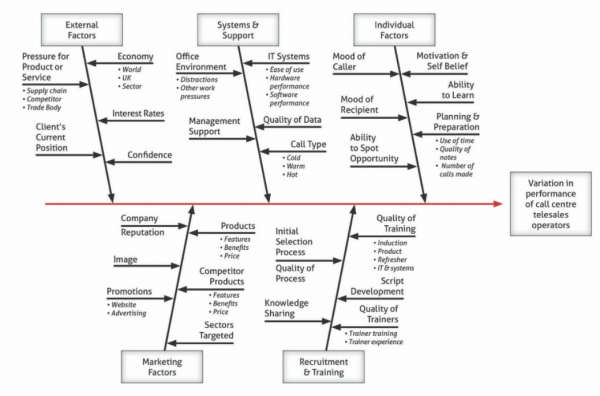
Or, we have jettisoned the original outline and gone for something completely different as in the example above, where we were concentrating of the difference that made the difference between telesales operatives.
Whilst Ishikawa was originally developed as a quality control tool, it can, and should, be used in a variety of other ways, for instance, you can use it to:
- Look at root and contributory causes of problems.
- Highlight bottlenecks in your processes.
- Identify where and why processes are not working.
How to Use the Tool
Essentially there are four steps to creating a useful and robust Ishikawa diagram.
Step 1: Identify the Problem
First, write down the problem you face as concisely and succinctly as possible. You might also identify who is involved and when and where it occurs.
Then, write the problem in a box on the left-hand side of a large sheet of paper, and draw a line back across the paper horizontally from the problem box. This arrangement, looking like the head and spine of a fish, provides the space in which to develop ideas.
Step 2: Identify the big issues
Next, brainstorm the key factors, the big issues, that feed into the problem. These may be systems, equipment, materials, external forces, people involved with the problem, and so on. You can use any of the models above, or invent your own
Then draw a line off the “spine” of the diagram for each of the issues you have identified.
Step 3: Identify Possible Causes
Essentially, repeat the above step for each of the factors you considered, brainstorm the possible causes for each and show these possible causes as shorter lines coming off the “bones” of the diagram. Where a cause is large or complex, then it may be best to break it down into further sub-causes and show these as lines coming off each cause line.
Step 4: Analyse Your Diagram
By this stage you should have a diagram showing all of the possible causes of the problem that you can think of. You should have a complete overall picture with all the necessary granularity in each of the bones.
Depending on the complexity and importance of the problem, you can now investigate the most likely causes further. This may involve other tools 5 Why and 8D, it may also involve setting up investigations, conducting surveys, and so on.
Conclusion
The Ishikawa cause-effect diagram is a great concept that allows:
1. A holistic view of a problem to be created
2. Complex problems to be broken down into smaller more manageable components
3. A systematic investigation of the issues
4. A means of assessing the most likely causes of the problem
Related tools and ideas
- 5 Why analysis
- 8D analysis
Recommended references
- Dragon Slaying: a better way to manage by Mark Woods; email mwoods@statius.co.uk to receive your free copy
Downloadable resources
- None
To find out how Statius can help you deliver:
• Better strategies
• Better systems
• Better measurement and
• Engaged people delivering
• Better results
Call us now on 0208 460 3345 or email sales@statius.co.uk
Comments are closed