There’s a great company called Action Coach set up by an Aussie, a great guy, called Brad Sugars. He’s built a global coaching empire mentoring entrepreneurs though a network of coaches delivering support via 1:1’s, events, seminars and workshops. They use a bundle of tools to help their clients and The 5 Ways is a core part of their toolkit.
As part of the model, it is pointed out that we normally we look at profit development from the standpoint of just three variables; sales, expenses and profits, as defined by the formula:
- Sales – Expenses = Profits
In this approach, each variable depends on the other, so normally businesses look at either increasing sales or decreasing expenses in order to improve profitability.
I think, but you may have a different opinion, that if you are trying to grow The 5 Ways model takes a more useful, more granular and deliberately customisable approach. This approach allows you to work on each component of the 5 ways model to leverage profit using what’s called a “divide to multiply” principle (no…I’d never heard of it either!)
Interestingly, with customers revenue and profit, there are actually 8 components to the model, but it’s called the 5 ways model there are only 5 parts of the model you can influence, change or drive. You can’t suddenly say I’ll have more customers please, I’ll have more profit please …you need to do something internally, to pull on some lever, that a company can influence.
So, according to “The 5 Ways” model, business is driven by five key profit generating areas:
- Lead Generation
- Conversion Rate
- Average Sale
- Average Number of Transactions
- Profit Margin
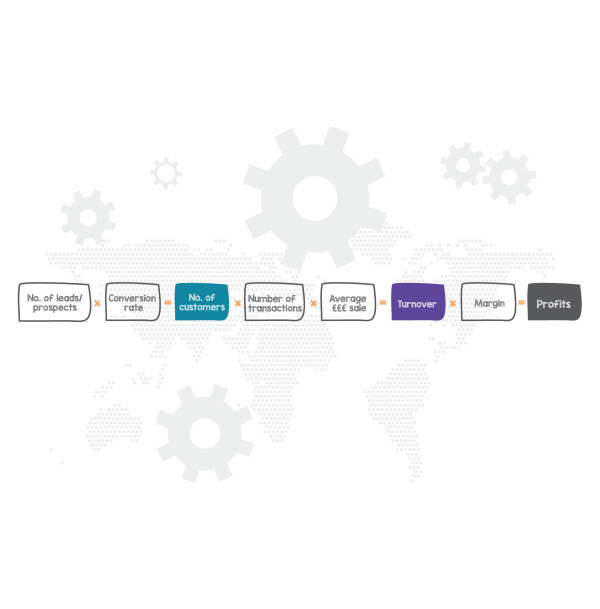
Diagrammatically, it looks like this:
Obviously, this model is a generic model and needs to be adapted to not only different companies but also different routes to market within a company. A telesales process will have different components to a digital marketing process which will have different components to a referral process. The trick is to establish your model and then increase / leverage the component parts to increase your sales and profits while keeping expenses constant.
As you can see from the diagram, customers, revenue and profit are the “outputs” or “results”. The 5 areas (levers) that make up a profit-generating equation as seen in the clear boxes: Leads, Conversion Rate, Average Sale, Number of Transactions and Profit Margin, these are the “inputs” that drive the “outputs”.
So, rather simplistically, if you want to change the outputs in the formula, you simply change the inputs.
Easier said than done right?
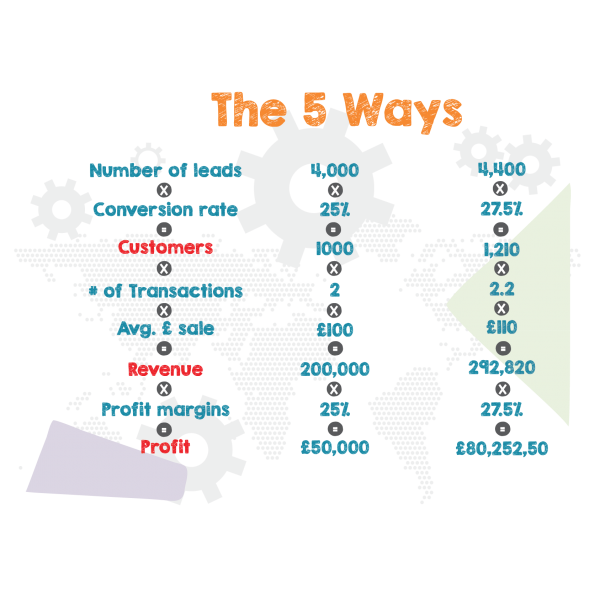
The real strength of The 5 Ways Model lies in the compounding effect, (remember, Einstein called compounding the 8th wonder of the world), so, if we increase both the number of leads AND the conversion rate, one multiplies the other! In reality, this means improving your processes little by little, bit by bit, but because we are compounding, small improvements to each process or activity can improve your results in a dramatic way. Taking the generic 5 ways model a 10% increase in each results in a 60+% increase overall.
So taking component each in turn:
Lead Generation:
Lead generation is the lifeblood of any business and leads can only be generated from an effective and efficient sales and marketing system, be that telesales, online, direct mail brochures or some other method. The challenge is knowing which marketing strategies are working! That being the case, unlike the pioneer of marketing, John Wanamaker…he’s the guy that said “Half the money I spend on advertising is wasted; the trouble is I don’t know which half!” we need to be a bit more scientific than that! We absolutely need to know where we get best bang for our buck.
The other point is we can change our processes so that we can either introduce more methods of lead generation that work or test new methods of lead generation to see if they work. We can do more telesales, we can start a Google Ad campaign, we can appoint a PR agency, we can implement a referral strategy, all of which should result in more leads…but a key question is do they get us the right leads? A handy concept at this stage is the acquisition cost of lead…but more of that another day.
Conversion Rate:
This is where the strength of your sales team is tested in anger… without a robust sales process your lead generation efforts are not being properly leveraged.
The conversion rate is calculated from the percentage of people that actually bought versus those who could have bought. For example, if you have 10 sales visits / quote submissions and 3 clients take up the offer then the conversion rate is 3 out of 10, or 33.3%. However, it is argued that sometimes it takes months or years before the client commits. It’s different for different companies and sectors but we tend to assess the rate over each quarter. You may win work that was quoted in a different quarter but that does not count. As long as the measurement is consistent from quarter to quarter, and it is going up, the percentage does not matter but your process is improving.
Again, the conversion rate can be worked on, you can make changes and adaptations to the sales follow up and close out activities to increase the conversation rate; you can change the way in which proposals are presented, you can arrange follow up visits to discuss the proposal submitted, you can initiate a new training programme, you can create more compelling copy (perhaps using The Formula for Change, subject of another blog) and you can offer discounts (but only at the last resort!)
Number of Transactions:
This is the average number of orders the average customer will make over a year. Ideally, you’ll want to develop repeat customers as it’s a great way to cost-effectively increase your profits.
Many business owners make the mistake of subscribing to the myth of once a customer, always a customer – not true. Successful businesses have effective ways to ensure they keep coming back. These are the guys that know and trust you, so it’s far a more cost-effective strategy to regularly communicate with them ensuring that are aware of your latest offering in whatever way suits; it could be face-to-face, emails, newsletters or blogs. The key is to drive up the number of transactions.
Average Sale:
Average sale is the average amount spent by the average customer with each order. Up-selling and cross-selling products that are of value to the customer at the point of sale will really help to increase your revenues.
Think of how many times you have been asked “Would you like to go large?”, and how many times have you spent slightly more than you initially intended?
Having consistent up-selling or cross-selling tactics in place will make a huge difference to profits.
Profit Margins:
The margin is the profit percentage of each and every sale. Simply put, if a business sells something for £100, and £25 was profit, the profit margin is 25%.
It is vital to know profit margins for each product or service you sell; this way you can ensure you are maximising sales of your most profitable lines and minimising time and resources selling low-profit margin lines.
Links to your key performance indicator dashboard
The various components of your individual 5 ways model then need to link to the way in which you monitor your key performance indicators.
You can get really clever with this linking this to concepts like the lifetime value of customers, discounting models, the marketing budget and allowable acquisition costs …but they are all subjects for different day…
Lets now work the model
Working the model
Once you have your model, remember it will need to be modified to suite your processes and circumstances, you’ll probably find that some aspects will be easier to work on and improve than others. Very generally, although not true in all instances, is the order in which the model should be attacked is:
Margins first – usually dead easy to raise, obviously you’ll lose some business but that may 1) have a negligible effect on overall profitability (you have just raised your margins) 2) with improved margins but less work, free up time for you to think about other aspects of the model.
Conversion rate – there is no point in piling in more leads at the “beginning” of the funnel if your conversion rate is dire, so work on improving the conversion rate next.
Number of transactions – you have won the customer and it’s taken time and effort, and they now trust you…what else can you now do for them that they’d value?
Average sale – This is the up-sale. The archetypal version of this is the McDonalds “Would you like fries with that” “Can I supersize that”. What are your “fries”., once you have that make it part of your, or your teams’ script. Essentially, what else can you sell?
Leads – This part of the process usually costs the most amount of money and has the greatest number of unknowns, tackle this last.
Conclusion
As with other tools the 5 Ways can, and should be, adapted to suit the needs of the individual company. As an example, we have made our 5 Ways more granular again by incorporating the number of ‘phone calls made by the telesales team and the call to visit conversion rate. Additionally, you may have different sales processes and therefore different “5 ways” for different products and services
Finally, Action Coach have nearly 400 different strategies and tactics divided across the above 5 levers, now not all of those will be appropriate for all organisations, but that’s an awful lot to choose from and my guess is that you’ll think of others, or at least variations on a theme, that will work for you.
Related tools and ideas
- Lifetime value of customers,
- Discounting models
- Marketing budget
- Marketing ROI tracker
- Allowable acquisition costs
Recommended references
- Business Coach website marcosoares.co.uk
Downloadable resources
- The 400 strategies (The 5-Ways Handout © Action Coach)
To find out how Statius can help you deliver:
• Better strategies
• Better systems
• Better measurement and
• Engaged people delivering
• Better results
Call us now on 0208 460 3345 or email sales@statius.co.uk
Comments are closed